ABCD of JMeter
At present time software companies are trying to deliver best quality product to their customers. For this they must maintain a benchmark of their product that can ensure its quality. Maintaining the quality is not an easy task without proper resources. JMeter is one of the most useful resources for this purpose.
JMeter is a desktop application testing tool which is used to do load testing and performance verification of software services and products. It is built on Java platform. Before going deep into the JMeter functionality lets dig a little about software testing.

Types of Testing
Software testing can be divided into two parts
- Functional Testing: As the name depicts this testing verifies the working of various functions, specifications, and features of the software, it can be further divided into
- Unit Testing
- Integration Testing
- System Testing
- Sanity Testing
- Smoke Testing
- Interface Testing
- Regression Testing
- Beta/Acceptance Testing
- Nonfunctional testing: This testing is done to verify the operational behavior of the software.
- Load Testing
- Performance Testing
- Stress Testing
- Reliability Testing
- Volume Testing
- Security Testing
- Compatibility Testing
In this scope of discussion, we will concentrate only on Nonfunctional testing and specifically on load, performance, and stress testing.
Performance Testing
Performance testing gives analysis of your application's performance under stress conditions like how many errors are generated which is called Reliability, how much memory and CPU usage is increased which is called Stability.
Stress Testing
Stress testing is done to know the break point of your application to know the maximum load handling capacity of your servers.
Load Testing
What is Load Testing
In the term load testing, load refers to the number of users accessing the software at a single point of time. They are load to the application because they are using the resources of the server. Load can increase or decrease because it depends on the number of users using the software. Performance of a software can fluctuate if load on it varies, like it can run smoothly on low load conditions and can go down in high load conditions. This type of fluctuation represents the incapability of the software and its resources. To detect this behavior, load testing is done.
How to do Load Testing
Load testing can be done in two broad ways, one can do it manually by creating real world users, but it can cost manpower, so it is preferable to use load testing tools like Apache JMeter, LoadNinja, WebLoad, LoadUI pro, etc. We will stick to Apache JMeter in this discussion.
How to install JMeter
To install JMeter, you need to follow the below steps:
- Download and install latest JDK in your system.
As you know, JMeter is a pure Java based application, so it will require JDK. - Go to the official site of Apache JMeter and download the latest Binary file.
- Extract the Zip File into a folder.
- Now you will find a bin directory inside it. Open the command-line-interpreter (cmd.exe for windows, terminal for Linux/Mac/Unix)
- If you are on Windows type:
JMeter.batand press enter. - If you are using Linux/Mac/Unix then type:
./jmeter.sh.
- If you are on Windows type:
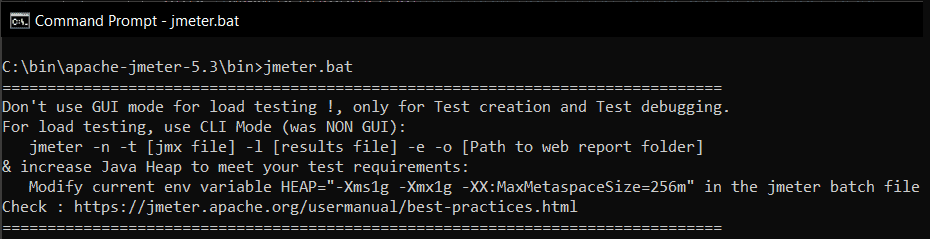
After this you will see an interface like this
This phase is called the Test Plan. Now if you are wondering what it is, don't worry. We have got you covered.
Perform Testing in JMeter
For performing your test cases in JMeter, first you need to configure them. For this, you need to follow these steps:
Configure Your Test Plan
Configuring a test plan in JMeter is the basic step you will perform to run your test in JMeter. But before understanding how to configure it, let's take some reference about it.
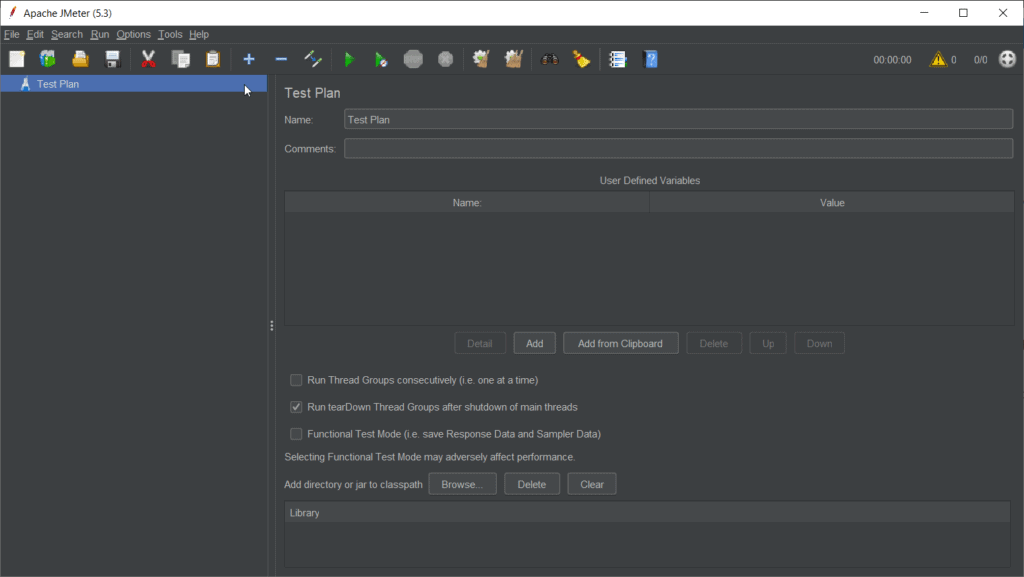
What is Test Plan?
In reference to JMeter a test plan is your test structure. It means every test step you want to perform in JMeter, you will describe it in your test plan. Test plan is a treelike structure:
- Test Plan
- Thread Group
- Controller
- Sampler
- Controller
- Thread Group
Different elements of Test Plan
A test plan is comprising different elements as:
Thread Groups:
Thread Groups is the fundamental element of the test plan. Here a thread is referring to a user. This simply means that you will define the number of users which will simulate the test case for you. A thread group further contains some more fields to fill.
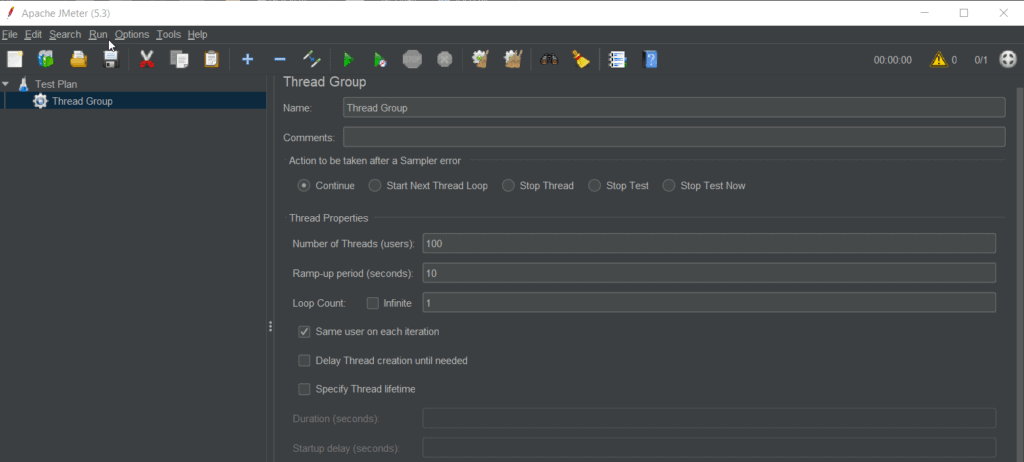
Number of Threads (users): Number of users who will operate your application.
Ramp-up period (seconds): Ramp-up period is the time in which it will load all users to the application. For example, if you have filled a Ramp-up period of 10 seconds for 100 threads, then JMeter will load 100 users in 10 seconds, i.e. 10 threads in 1 second.
Loop Count: It means how many numbers of times your threads will be loaded.
Specify Thread lifetime: Selecting this checkbox will provide you with a schedular. clicking this checkbox will enable Duration and Startup delay. Duration field will set the time in which your test will be run and Startup delay will add a delay before the starting of the test.
Controllers:
You can add controllers to the thread groups. Controllers will decide the basic actions of threads. Let's understand this with the type of controllers.
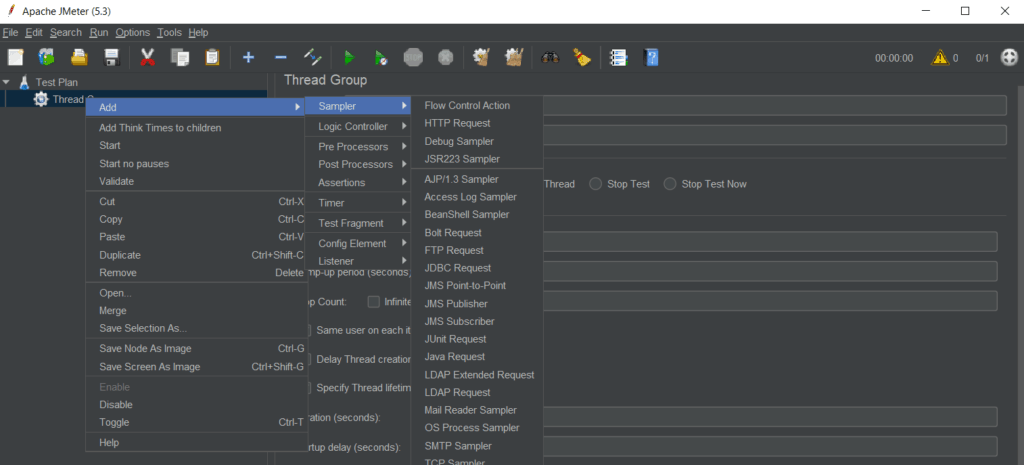
Samplers: Samplers decide which type of request thread(user) will send to the server. JMeter includes the many samplers like FTP, HTTP, JDBC, LDAP requests, etc.
Logic Controllers: You can use logic controllers to customize how JMeter will send requests.
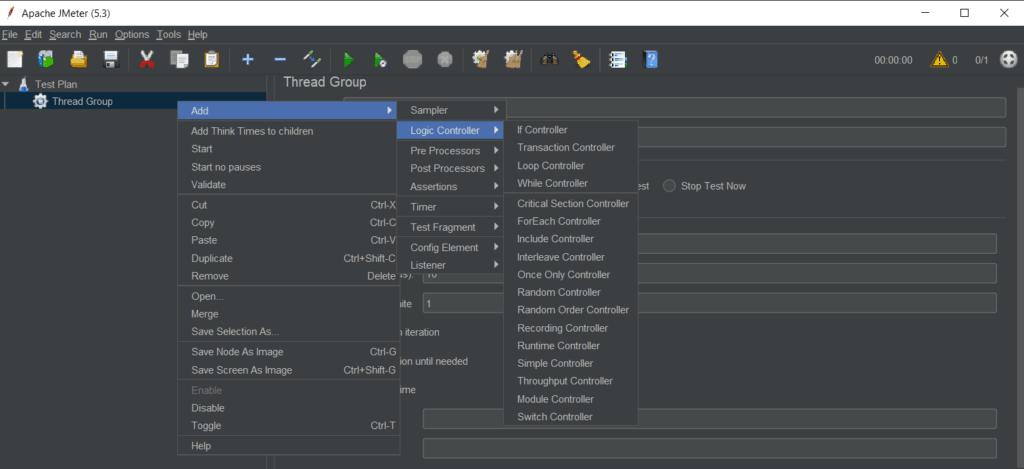
We can understand this by an example of an interleave controller:
Interleave Controller: Every controller controls its child elements, which are the samplers. Now suppose you want to send two distinct requests to the server but alternatively in each loop count, then you will assign two children to interleave controller like this.
- Test Plan
- Thread Group
- Interleave Controller
- Request A
- Request B
- Interleave Controller
- Thread Group
In the first loop Request A will be sent and in next loop Request B will be sent and it will continue this order.
Listeners:
Listeners catch the response of the requests sent by your threads and provide an analytical representation of it. There are different listeners in JMeter for different type of representation, like Summary Report, Aggregate Results, Graph Results, etc.
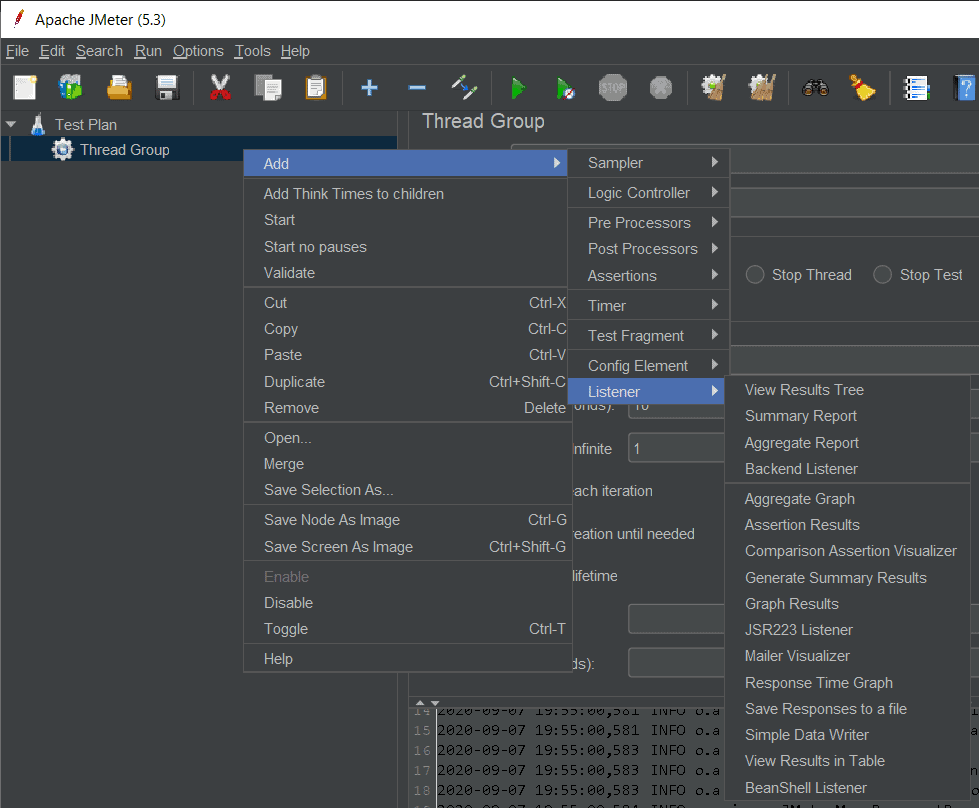
You can add a listener in anywhere in your tree. It will collect the data of the elements which are at its level or at its below level.
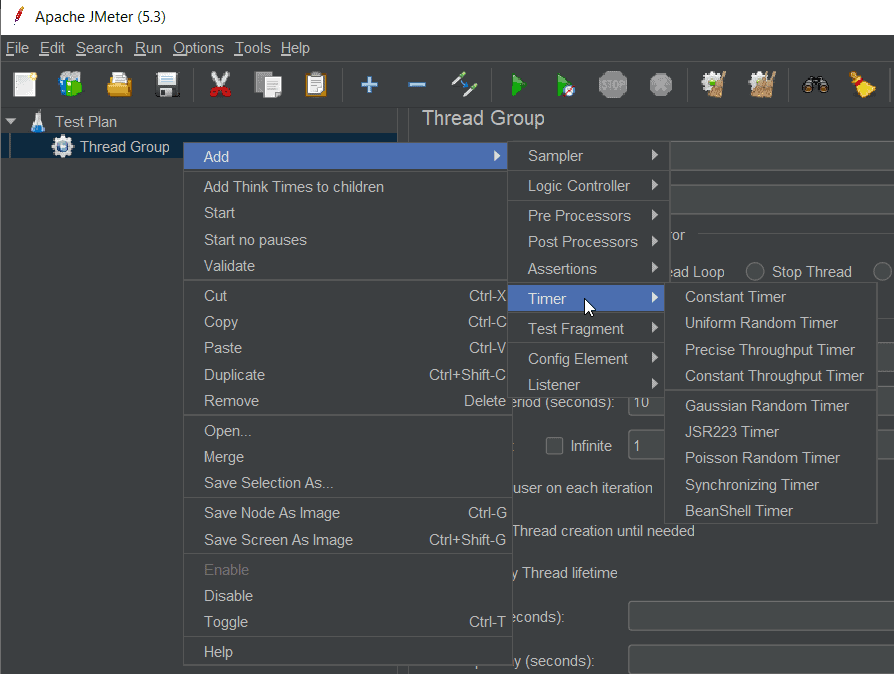
Timers:
Timers are delay elements; a timer element will put a delay between steps of your test plan. You can put timers between consecutive samplers or even between consecutive controllers. They are useful because JMeter can overwhelm your servers by sending too many requests in a very short interval.
Assertions:
Assertions are like a test result checker; it validates that response of the request contains the desired results. You can define a desired condition in the assertion and if the response does not fulfil this condition, then the assertion will mark the request as a failed request. For applying assertion to a particular sampler, you need to make the sampler child of the assertion.
Configuration Elements:
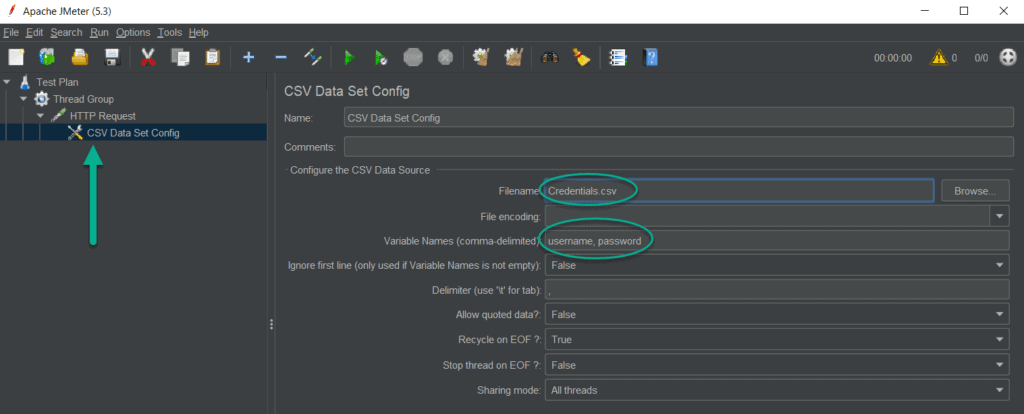
As the name depicts configuration elements, help in the configuration part, variables can be defined in them, and you can use these variables in your request. Configuration elements are put just before any sampler. For example
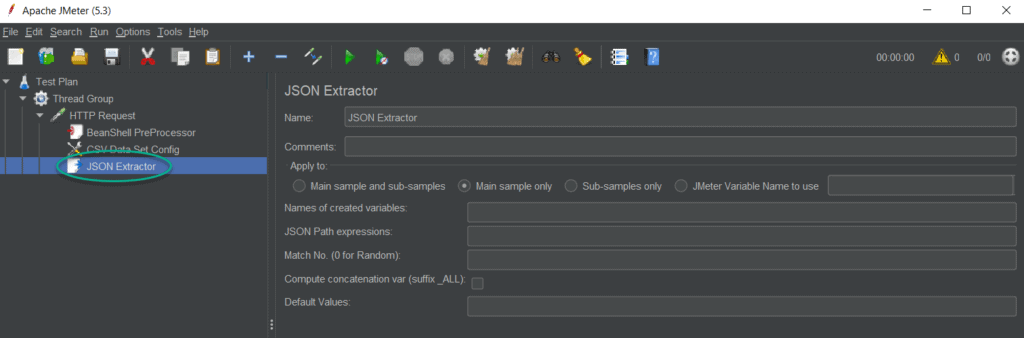
CSV data set config: Let's take a scenario, to perform a login with 100 users. You can create a CSV file containing 100 credentials and this configuration element will read data from your CSV file.
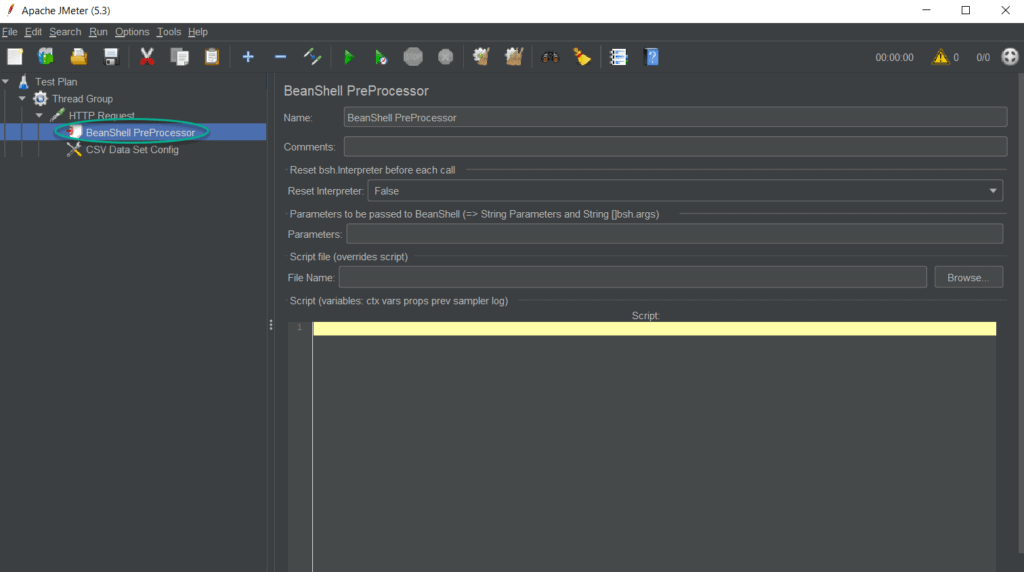
Pre-Processor Elements:
Pre-processor elements helps you to make your test cases more dynamic and flexible. You can put your scripts in different programming languages and database queries for generating random data, in the pre-processor elements. You can add a pre-processor element to your sampler, and it will run just before the sampler.
Post-Processor Elements:
Also, like pre-processor elements, you can write a script in post-processor elements too, difference is just this script will run just after the sampler. These elements can be used to extract something from the sampler response or to do further calculations on the response to get the desired result. You might use this result in your next request.